.svg)


Unified Ranking vs. Reserved Tiles: The Ad Revenue Gap

%201%201.png)
Unified Ranking vs. Reserved Tiles: The Ad Revenue Gap
How much more retail media ad revenue could you be making with a more modern ad server?
It is a question most retail media leaders have a gut feeling about but have never been able to answer precisely. The percentage lifts cited in the industry sound compelling until they have to survive a budget conversation. So here is what the gap between reserved tiles and unified ranking retail media actually looks like in dollar terms, using a framework you can apply to your own numbers today.
The answer is significant. And none of it requires new traffic, a redesigned frontend, or a different advertiser base.
TL;DR: A retail media network running a legacy, reserved-tile ad server is leaving between 80% and 140% of its current sponsored product revenue on the table every year. That gap closes through three specific mechanisms: reducing cannibalization, increasing auction density, and improving the relevance-to-revenue ratio. Together, they drive ad revenue increases documented in A/B tests run against existing stacks across fashion, health and beauty, pharmacy, and home improvement retailers. Where you land in that range depends on your starting architecture.
What Reserved Tiles Actually Cost You
Think about the last time you searched for something on a retail site and the first few results felt completely off. Not wrong exactly, just not what you were looking for. You scrolled past them. Maybe you clicked further down the page. Maybe you left.
That experience, which every shopper recognizes, is often the direct result of a reserved-tile architecture. Sponsored products occupy fixed positions on the page, decided by bid price and budget, with no visibility into what your search engine has determined is actually relevant to that query. The ad server and the search engine are running separate logic on the same page, competing for the same shopper's attention without coordinating on what that shopper actually wants.
You already know what this costs in qualitative terms. What is harder to see day to day is what it costs in revenue, because that cost shows up as missed upside rather than a visible loss. You are not losing money you can point to. You are leaving money you never collected.
That is the gap unified ranking closes.
The Math
Rather than anchoring to a single hypothetical baseline, apply this framework to your own current sponsored product revenue.
A/B tests comparing unified ranking against legacy, reserved-tile ad serving have shown ad revenue increases between 80% and 140%, depending on the starting architecture.
Applied to three realistic starting points for a mid-to-large retail media network:

The percentage does not change. The dollar figure scales with whatever your program is generating today. Take your current sponsored product revenue and apply the range. The result is your gap.
This is not a hypothetical upside. It is the documented outcome of moving the ranking decision out of a siloed ad server and into a layer that evaluates organic and sponsored products against the same relevance and performance signals.
Where the Lift Actually Comes From
The uplift is not the result of showing more ads. It comes from three specific mechanisms, each of which has a direct and measurable revenue effect.
Unified ranking reduces cannibalization. In a reserved-tile system, you are often paying to show a sponsored product the shopper would have clicked on organically anyway. That spend produces no incremental value. Unified ranking removes that overlap, so every dollar of ad spend is working toward a placement the shopper would not have reached without it.
It increases auction density. When unified ranking connects to RTB demand from external platforms, more advertisers compete for the same inventory in real time. More competition for the same placement drives up the average price per click, independent of any change in traffic or conversion rate.
It improves the relevance-to-revenue ratio. In a reserved-tile system, increasing ad load almost always reduces conversion, because the ads are poorly matched to what the shopper is searching for. Unified ranking scores every product, organic and sponsored, against the same relevance signals. A sponsored product only wins a placement when it is genuinely competitive with the organic result it replaces. That means ad load can increase without degrading the shopping experience, which is the mechanism that makes the higher end of the range achievable rather than theoretical.
These three effects compound. None of them require new traffic, a redesigned frontend, or a different advertiser base. They come from changing where the ranking decision is made.
Why the Range Is Wide
An 80% lift and a 140% lift are both real outcomes, observed across different retailers and verticals. The width of that range reflects how constrained the starting architecture was, and two specific conditions determine where a retailer lands.
The first is relevancy overlap. When there is low overlap between the products being advertised through demand sources and the products shoppers are actually searching for, the relevance uplift from unified ranking is more limited. The ranking layer can only optimize what it has to work with. If the sponsored candidates entering the system are structurally mismatched to organic intent, the lift will sit toward the lower end of the range.
The second is position access. Unified ranking performs best in higher positions on the page, where shopper intent is strongest and competition for placement drives the most value. Retailers whose ad setups reserve top positions for direct brand deals, outside the unified ranking system, limit the surface area where the optimization can operate. The more of the grid that is open to unified ranking, the higher the potential lift.
A retailer with strong relevancy overlap and open position access across the grid tends to land toward the higher end. A retailer with limited overlap or restricted top positions tends to land toward the lower end. Understanding which conditions apply to your program is part of what a live A/B test surfaces.
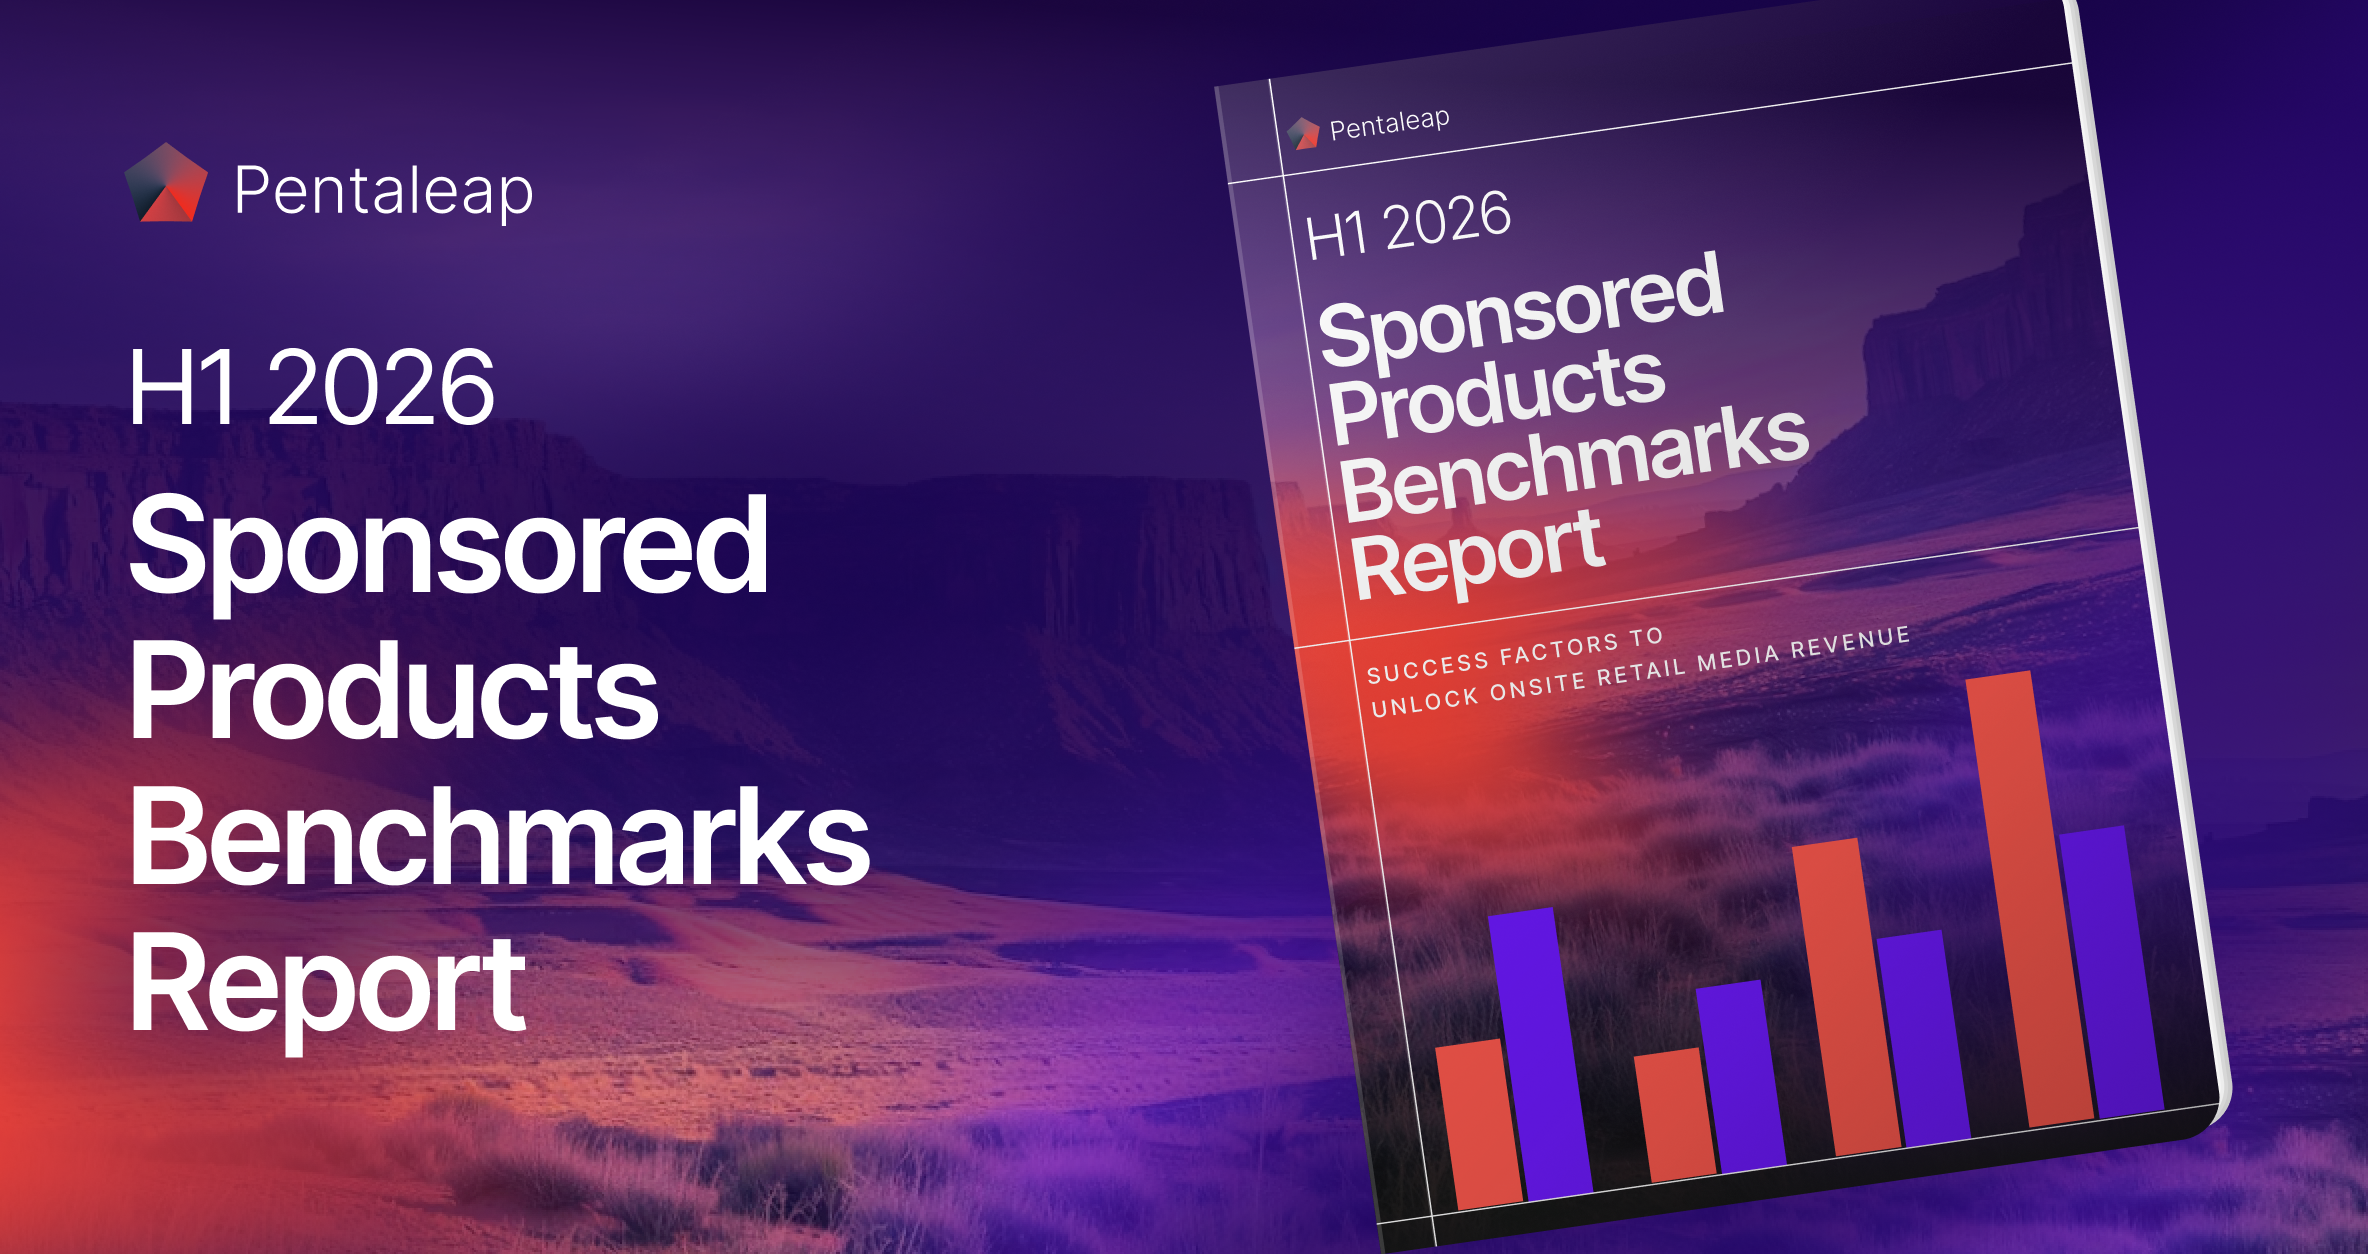
The Pentaleap H1 2026 Sponsored Products Benchmarks Report shows this pattern playing out industry-wide. Sponsored products coverage grew 10% year-over-year across tracked retailers in Q4 2025 to Q1 2026, accelerating from 7% the prior period.
The Honest Caveat
This framework assumes your current architecture is, in fact, a reserved-tile, siloed model. If you have already introduced some form of unified ranking, or if your demand access is already diversified beyond a single ad server, your starting point is different and the applicable range may sit lower.
Two specific conditions can also push results below the 80% floor. The first is low relevancy overlap between the products being advertised through demand sources and what shoppers are actually searching for. When sponsored candidates entering the system are structurally mismatched to organic intent, the relevance uplift is more limited. The second is top-position exclusions. Unified ranking performs best in higher positions on the page. Retailers whose ad setups reserve those positions for direct brand deals outside the unified ranking system limit the surface area where the optimization can operate. If either condition applies to your program, your result may sit below 80%.
The way to know for certain is not to estimate it. It is to test it.
How to See Your Own Number
The only way to know exactly where your network falls in the 80-140% range is to run the comparison against your own stack, your own catalog, and your own demand mix. Estimates are useful for budget conversations. A live A/B test is what tells you the real number.

Pentaleap runs this test alongside your existing ad server, without disrupting current campaigns or advertiser workflows, in three weeks. We have run it with some of the largest retail media networks in the US, consistently, across verticals and stack configurations. The result is always a precise, defensible number you can take into any budget conversation.
Run the test. Keep your stack. See your number.
Run a live A/B test with our team.
Frequently Asked Questions
What does unified ranking mean in retail media?
Unified ranking means organic and sponsored products are evaluated against the same relevance and performance signals within a single ranking system, rather than being decided by two separate systems, an ad server for sponsored and a search engine for organic, that do not share information.
How much additional ad revenue can unified ranking generate?
A/B tests comparing unified ranking against legacy, reserved-tile ad serving have shown consistent revenue increases between 80% and 140%, depending on how constrained the starting architecture was and how much of the product grid is open to unified ranking optimization.
Does a reserved-tile ad server limit ad revenue?
Yes. Reserved-tile architectures place sponsored products into fixed positions based on bid and budget alone, without coordinating with organic search relevance. This creates both a relevance ceiling and a demand ceiling, since most reserved-tile ad servers were not built to support real-time bidding from external demand sources.
How long does it take to test unified ranking against an existing stack?
A live A/B test can typically be run in three weeks, alongside an existing ad server, without disrupting current campaigns or advertiser workflows.
What determines where a retailer lands in the 80-140% range?
Two factors matter most. The first is relevancy overlap between the products being advertised through demand sources and what shoppers are actually searching for. The second is how much of the product grid, particularly higher positions, is open to unified ranking rather than reserved for direct brand deals.
Ready to see what the gap is worth for your business?
Run a live A/B test against your existing stack and find out exactly where your revenue stands in the 80-140% range. Schedule a strategy session with our team today.
Stay Ahead with Retail Radar
Subscribe for cutting-edge insight into the latest retail media developments and trends
.png)

.webp)